Article Content
- 1. Understanding True Lifecycle Costs: Why “Cheapest per kg” Often Misleads
- 2. Key Cost Components in Detail (2026 Perspective)
- 3. Technology-Specific LCCA Profiles – 2026 Data
- 4. Practical Decision Framework & Worked Example
- 5. Optimization Strategies to Lower Your True Lifecycle Costs
- Conclusion: Turn H₂S Removal into a Strategic Advantage
In the oil and gas, biogas, and industrial sectors, H2S removal is not merely a technical necessity—it is one of the most consequential financial decisions a facility will make. While many operators still select technologies based primarily on upfront chemical price or capital expenditure, the true cost of H₂S management extends far beyond the initial purchase order. Over a typical 5- to 10-year project horizon, hidden costs such as spent media disposal, unplanned downtime, corrosion damage, labor, regulatory compliance, and environmental liabilities can easily double or triple the apparent “sticker price.”
This is where Lifecycle Cost Analysis (LCCA) becomes indispensable. LCCA is a structured methodology that calculates the total cost of ownership (TCO) of an H₂S removal system, enabling operators to make decisions that optimize both near-term cash flow and long-term profitability, safety, and sustainability.
In this comprehensive 2026 guide, we deliver a practical, field-tested LCCA framework specifically tailored to oil & gas, biogas/RNG, pulp & paper, and water treatment applications. We break down every major cost driver, present current technology-specific economics, include a detailed worked example, and share proven optimization strategies. Whether you are evaluating options for a new sour gas well, an RNG upgrading facility, or an existing production battery, this article will give you the tools and confidence to select the solution that truly delivers the lowest total cost of ownership.
Recommended companion reading: For a broader overview of technology selection criteria and real-world case studies, see our detailed guide: How to Select the Correct H2S Removal Technology.
1. Understanding True Lifecycle Costs: Why “Cheapest per kg” Often Misleads
The most frequent mistake in H₂S project evaluation is relying on simplified metrics such as “cost per kilogram of H₂S removed” or initial capital expenditure (CAPEX). While these numbers are useful for quick screening, they ignore variables that dominate economics over the life of the asset.
A complete LCCA must account for the following categories:
Capital Expenditure (CAPEX)
- Vessels, skids, piping, instrumentation, foundations, and electrical
- Engineering, procurement, construction, and commissioning
- Permitting and site preparation
Liquid scavenger systems often have very low CAPEX ($25,000–$150,000 installed for many applications). Regenerative or biological systems can require $500,000–$2.5M+ in major equipment. However, low CAPEX frequently correlates with higher ongoing OPEX and logistics burden.
Operating Expenditure (OPEX)
- Consumables (scavengers, adsorbent media, chemicals, nutrients)
- Utilities (electricity, instrument air, steam, water)
- Labor for monitoring, sampling, and media changeouts
- Routine maintenance, spare parts, and calibration
Hidden and Indirect Costs (The Real Budget Killers)
These categories frequently represent 30–60% of total lifecycle cost but are routinely underestimated:
- Disposal of spent media and reaction byproducts — Often the single largest ongoing expense
- Downtime and lost production during changeouts or upsets ($50k–$500k+ per day on high-value streams)
- Corrosion damage to pipelines, compressors, and downstream equipment when removal is inadequate
- Regulatory fines, environmental liabilities, and ESG reporting costs
- Health, safety, and insurance premium impacts
End-of-Life and Decommissioning Costs
Site remediation, equipment salvage value, and residual liabilities must be included for an accurate picture.
When all elements are modeled consistently over a realistic 5–10 year horizon (using a discount rate of 8–12%), technology rankings frequently reverse. A system that appears expensive on day one can deliver the lowest total cost of ownership by year three or four.
2. Key Cost Components in Detail (2026 Perspective)
Disposal Costs: The Often-Ignored 25–45% Swing Factor
In 2026, disposal of spent H₂S media or scavenger byproducts remains one of the largest and most variable cost drivers. Classification and pricing vary dramatically by jurisdiction:
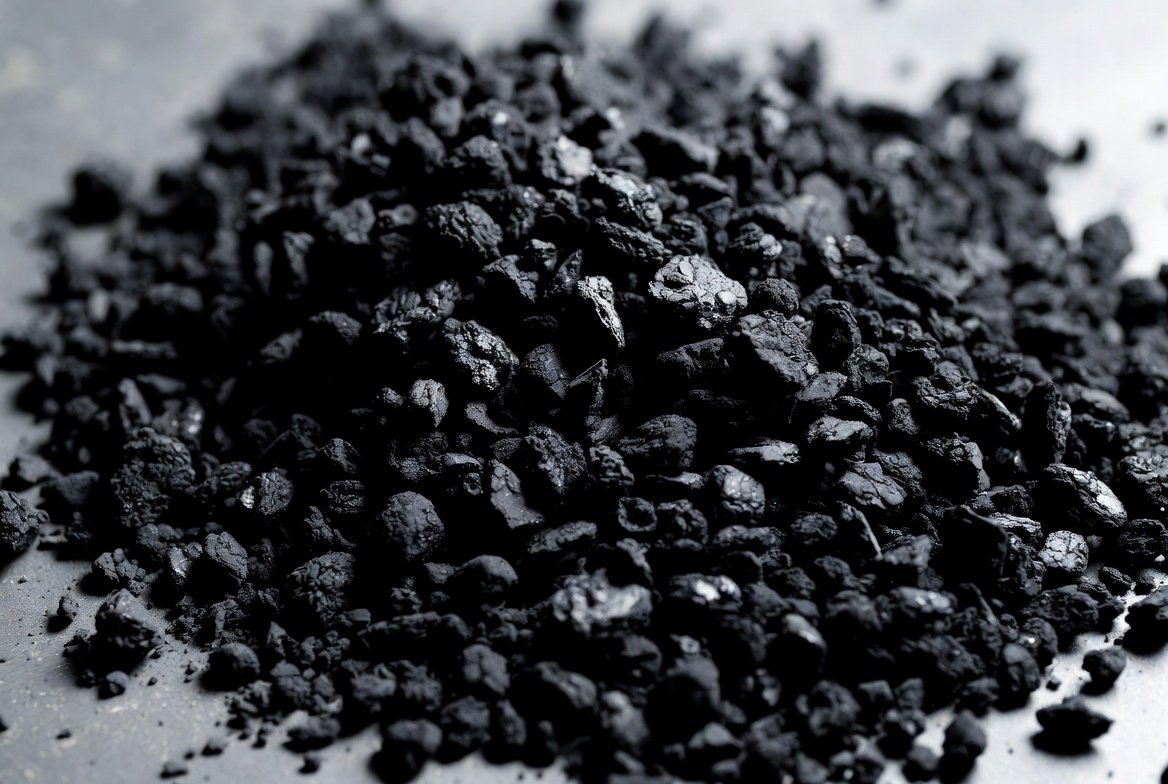
- Iron-based spent media: Frequently non-hazardous; landfill costs typically $80–$160 per tonne plus transportation.
- Impregnated activated carbon and certain triazine reaction products: Often hazardous waste at $350–$650+ per tonne.
- Biological systems: Produce hydrophilic elemental sulfur that can sometimes be sold as agricultural fertilizer, turning a disposal cost into a small revenue stream.
Operators who fail to model local disposal regulations and escalation (typically 3–5% per year) routinely discover their “low-cost” solution is actually the most expensive over time.
Downtime and Production Impact
For a 5 MMscfd gas stream, a single day of unplanned downtime can exceed $200,000 in lost revenue. Systems that allow online media changeout or redundant trains (common in dual-bed adsorbent or regenerative designs) often justify significantly higher CAPEX through avoided production losses alone.
Risk and Compliance Value
Assigning a monetary value to avoided risk is powerful. Proper H₂S control prevents:
- Pipeline and equipment corrosion (replacement costs can reach millions)
- Alberta and federal regulatory penalties (fines frequently exceed $100,000–$500,000 per incident)
- ESG and sustainability reporting liabilities that affect financing and insurance
Many sophisticated operators now apply a 10–20% risk premium to technologies with higher failure modes or poorer environmental profiles.
3. Technology-Specific LCCA Profiles – 2026 Data
The table below presents typical economics for major H₂S removal technologies based on FirstKlaz field data, 2026 pricing, and industry benchmarks. Figures assume a representative 2–5 MMscfd natural gas or biogas stream with 200–3,000 ppm H₂S and a 5-year project life. Actual results vary with gas composition, flow variability, location, and disposal regulations.
| Technology | Typical Installed CAPEX (2 MMscfd example) | Consumable Cost ($/kg H₂S removed) | Annual OPEX (excl. disposal) | Disposal Cost Impact | Est. 5-Year TCO (Present Value) | Regeneration Potential | Best Suited For |
|---|---|---|---|---|---|---|---|
| Triazine Liquid Scavenger | Low ($40k–$120k) | $8–16 | Medium | High (solid waste) | Medium–High | None | Low H₂S, simple operations, short-term or pilot use |
| Non-Triazine Liquid Scavenger (Zinc, proprietary blends) | Low–Medium | $10–20 | Medium–Low | Medium | Medium | None | Most gas streams, ESG-focused operators, mercaptan co-removal |
| Caustic Scrubbing (NaOH/KOH) | Medium | $12–25 | Medium | Medium–High | Medium–High | Limited | Moderate H₂S with high CO₂, high-pressure applications |
| FeO / Iron Hydroxide Adsorbent | Medium ($150k–$420k) | $6–14 | Low–Medium | Low–Medium | Low–Medium | Partial (some products) | High H₂S loads, steady flow, biogas, oil sands |
| Activated Carbon (Impregnated) | Medium | $15–30 | Medium | High | Medium–High | None | Polishing stage, mercaptan removal, low H₂S streams |
| Liquid Redox (e.g. LO-CAT style) | High ($450k–$950k) | Very Low | Medium (power + chemicals) | Low | Low (larger flows) | Full | Medium–high sulfur production (1.5–20 tpd), steady state |
| Biological Desulfurization | High | Very Low | Low–Medium | Very Low (often sellable sulfur) | Lowest (large, steady loads) | Full | Biogas/RNG, landfill gas, >1.5 tpd sulfur, ESG priority |
| Membrane Separation | High | Low (energy dominant) | Medium (compression) | None | Medium (high-pressure) | N/A | Bulk removal at high pressure, combined CO₂/H₂S treating |
Note: All figures are approximate 2026 estimates based on Western Canadian and U.S. field data. Actual costs depend on specific gas analysis, flow profile, location, and local disposal regulations. Hybrid systems (e.g., liquid scavenger + iron polishing) frequently deliver the lowest overall TCO by combining the strengths of multiple technologies.
Key 2026 Takeaways from the Data:
- For low H₂S loads (<300 ppm) and intermittent operation, modern non-triazine liquid scavengers often deliver the best TCO due to minimal infrastructure and good efficiency.
- For high H₂S loads and continuous operation, iron-based adsorbents or regenerative systems (redox/biological) frequently win on lifecycle cost despite higher initial CAPEX.
- Disposal costs can swing economics by 30% or more — always model your specific waste classification and local pricing.
- Hybrid approaches are increasingly popular in 2026 and often achieve the lowest total cost of ownership.
For technology-specific deep dives, we recommend our detailed comparisons: Activated Carbon vs. FeO-Based Adsorbents and the Latest Developments in H2S Removal (2026).
4. Practical Decision Framework & Worked Example
Step-by-Step LCCA Process
- Characterize your gas stream thoroughly — Measure H₂S, mercaptans, CO₂, water content, pressure, temperature, and flow variability. Small errors at this stage invalidate the entire model.
- Define constraints and objectives — Space limitations? Disposal restrictions (offshore, urban, Alberta-specific)? Uptime requirements? ESG targets? Desired project life and discount rate?
- Build base-case models for 2–4 viable technologies — Use consistent assumptions for discount rate (8–12%), inflation, and price escalation.
- Run sensitivity analysis — Vary H₂S concentration ±50%, disposal costs ±30%, energy prices, and labor rates. Identify which variables most affect the ranking.
- Apply risk weighting — Add a risk adjustment factor for technologies with higher failure probability or poorer environmental profiles.
- Document, review with stakeholders, and iterate — Present TCO per unit of gas processed or per kg H₂S removed over the full horizon.
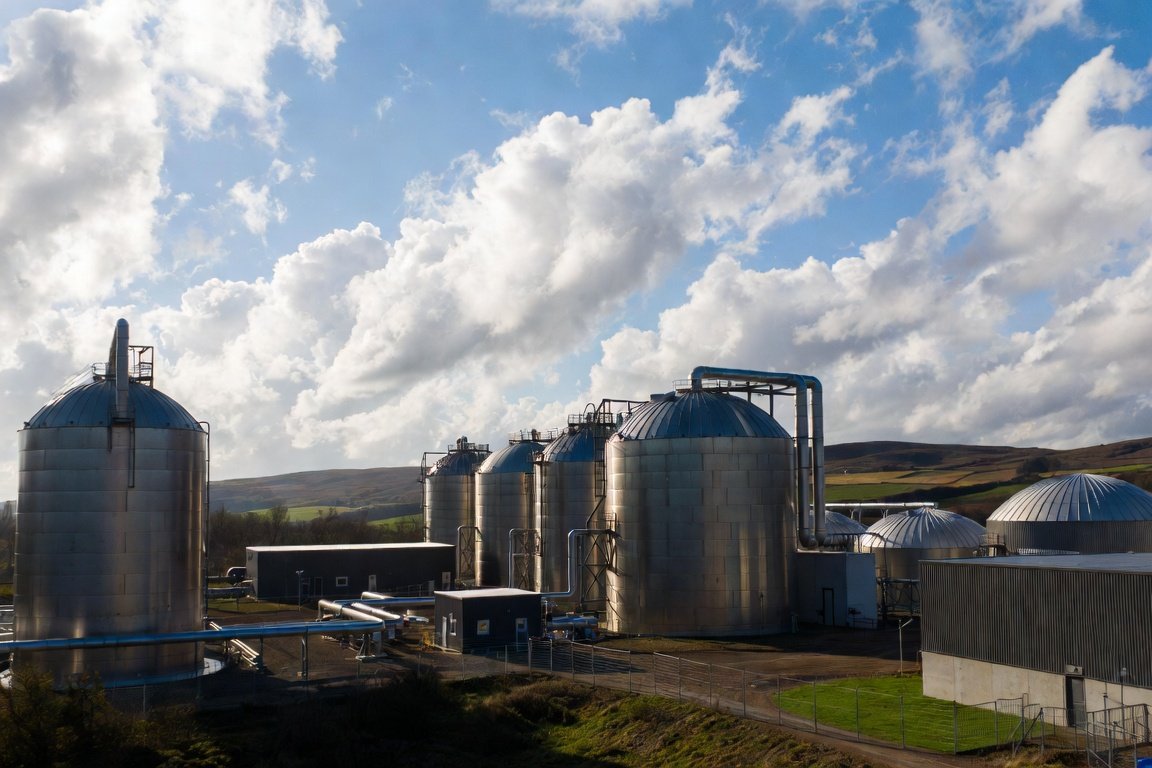
Worked Example: 800 scfm Biogas Stream, 2,500 ppm H₂S, 5-Year Horizon
Scenario assumptions (simplified for illustration):
- Inlet H₂S load: ~45 kg/day
- Discount rate: 10%
- Chemical/media price escalation: 3%/year
- Disposal cost escalation: 4%/year
- Alberta-based RNG facility with moderate disposal restrictions
Technology options modeled:
- A. Non-Triazine Liquid Scavenger (direct injection)
- B. Iron-Based Adsorbent (single vessel, pre-moistened media)
- C. Hybrid: Non-Triazine Scavenger + Iron Polishing
- D. Biological Desulfurization System (small bioreactor + sulfur recovery)
5-Year Total Cost of Ownership (Present Value) Results:
| Option | 5-Year TCO (PV) | Primary Cost Drivers | Key Advantage |
|---|---|---|---|
| A. Non-Triazine Liquid | $1,120,000 | High consumable volume + disposal | Lowest upfront cost, fast deployment |
| B. Iron Adsorbent | $870,000 | Media replacement frequency | Good capacity, relatively low disposal cost |
| C. Hybrid (Liquid + Iron) | $785,000 | Balanced consumables + polishing | Lowest overall TCO – optimized consumption and media life |
| D. Biological | $940,000 | High CAPEX offset by near-zero consumables | Sellable sulfur + excellent ESG profile |
Conclusion of the example: The hybrid approach (Option C) delivers the lowest lifecycle cost in this realistic RNG scenario, saving approximately $185,000–$335,000 versus pure liquid or pure adsorbent options over five years. The biological system becomes highly attractive if sulfur can be monetized and if the facility has steady high load with strong ESG priorities.
This example closely mirrors actual 2025–2026 projects we have modeled and implemented for RNG facilities in Alberta and the U.S. Midwest. The ranking can shift with changes in H₂S load, disposal pricing, or sulfur sales revenue.
5. Optimization Strategies to Lower Your True Lifecycle Costs
Once the right technology family is selected, significant additional savings come from operational excellence:
- Real-time optimization — Use continuous H₂S analyzers with feedback control loops to reduce chemical usage by 15–30%.
- Proper media conditioning — Pre-moisten iron-based adsorbents to 20–40% moisture and maintain optimal bed velocity to maximize capacity and life.
- Predictive maintenance & IoT monitoring — Detect early signs of breakthrough or fouling before costly upsets occur.
- Hybrid system design — Combine technologies (e.g., scavenger for bulk removal + adsorbent polishing) to exploit the strengths of each.
- Mobile and rental solutions — Ideal for pilot testing, seasonal peaks, or proving economics before major capital commitment.
- Green chemistry selection — CEFAS Gold or REACH-compliant scavengers can reduce disposal classification and support ESG goals.
- Correct initial sizing — Oversizing inflates CAPEX; undersizing causes frequent, expensive changeouts.
Many of these strategies are explored in greater depth in our article on Latest Developments in H2S Removal.
Conclusion: Turn H₂S Removal into a Strategic Advantage
Lifecycle Cost Analysis transforms H₂S removal from a reactive operational expense into a strategic, data-driven investment. By modeling the full 5–10 year picture—including the often-overlooked costs of disposal, downtime, corrosion prevention, and regulatory risk—operators can identify solutions that deliver superior economics, better compliance, higher uptime, and stronger ESG performance.
The difference between a “cheap” solution and the truly lowest-cost solution can easily exceed several hundred thousand dollars over the life of a typical facility. In today’s environment of tightening regulations, volatile energy prices, and increasing ESG scrutiny, that difference matters more than ever.
How to Select the Correct H2S Removal Technology